 Financials
Condensed Interim Consolidated Financial Statements For The Six Months And Full Year Ended 30 September 2025
![]() Note: Files are in Adobe (PDF) format.
Note: Files are in Adobe (PDF) format.
Please download the free Adobe Acrobat Reader to view these documents.
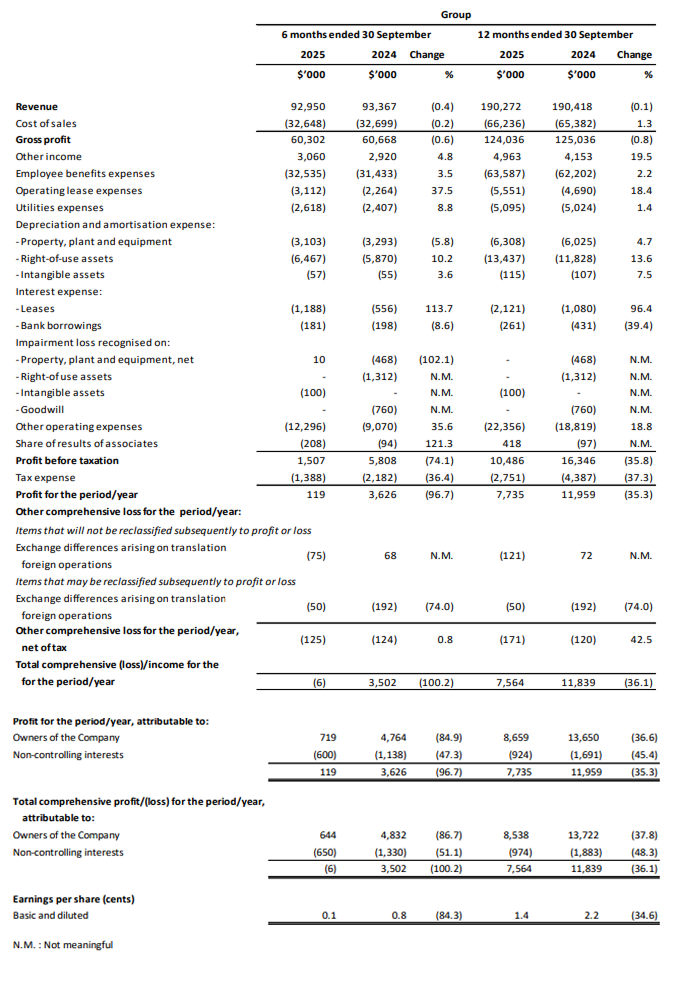
Condensed Interim Consolidated Statements Of Profit Or Loss And Other Comprehensive Income
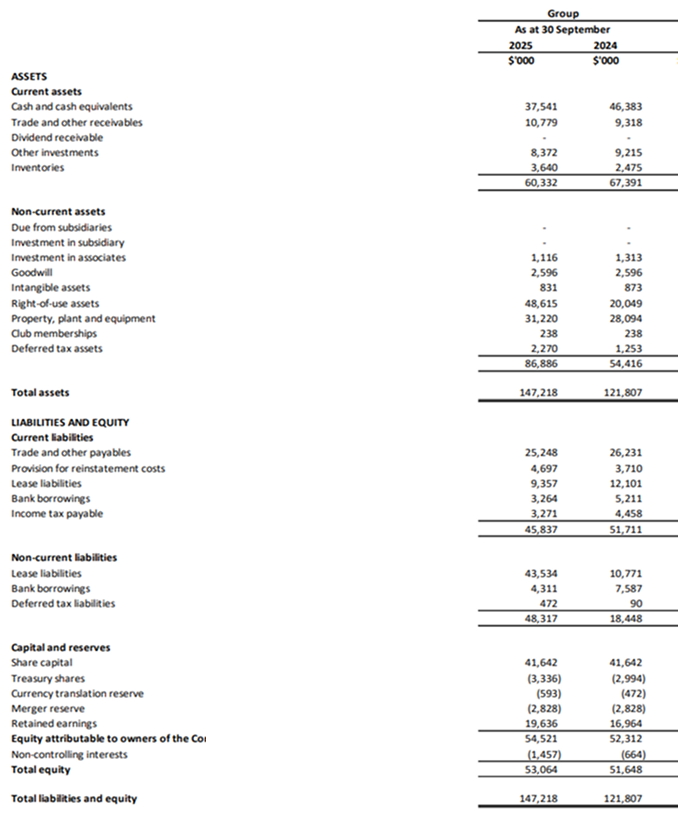
Condensed Interim Statements Of Financial Position
REVIEW OF PERFORMANCE OF THE GROUP
Revenue
Our Group’s revenue decreased by 0.4%, or $0.4 million, from $93.4 million for the six months ended 30 September 2024 (“2H2024”) to $93.0 million for 2H2025. On a full year basis, the decrease in revenue in 2H2025 was largely offset by the increase in revenue recorded in 1H2025. As a result, the Group’s revenue for FY2025 decreased marginally by 0.1%, or $0.1 million, from $190.4 million in FY2024 to $190.3 million in FY2025.
Revenue from our Singapore operations decreased slightly by 1.0% from $167.1 million in FY2024 to $165.4 million in FY2025. Sales across most of our existing outlets softened, reflecting a more competitive dining landscape and a moderation in discretionary dining spend. The incremental contributions from our two new outlets in Singapore helped to partially offset the overall slow down.
The People’s Republic of China (“PRC”) saw a slight moderation in revenue at $18.3 million in FY2025 as compared to $18.9 million in FY2024. This was partly due to the closure of one outlet during the year and the temporary two-month refurbishment of another, which reduced their sales contributions. Excluding these effects, revenue across remaining outlets collectively delivered a slight year-on-year improvement, driven by more targeted local marketing initiatives and stronger customer engagement.
Cost of sales
Cost of sales, which comprised raw materials and consumables, decreased marginally by 0.2%, or $0.1 million, from $32.7 million in 2H2024 to $32.6 million in 2H2025. Cost of sales increased by 1.3%, or $0.8 million, from $65.4 million in FY2024 to $66.2 million in FY2025.
Gross profit
Gross profit decreased by 0.6%, or $0.4 million, from $60.7 million in 2H2024 to $60.3 million in 2H2025. In line with the increase in cost of sales, the gross profit margin decreased from 65.0% in 2H2024 to 64.9% in 2H2025. Gross profit also decreased by 0.8%, or $1.0 million, from $125.0 million in FY2024 to $124.0 million in FY2025. Gross profit margin decreased from 65.7% in FY2024 to 65.2% in FY2025. The decreases were mainly due to the higher level of marketing activities aimed at building brand awareness.
Other income
Other income increased by 4.8% or $0.2 million, from $2.9 million in 2H2024 to $3.1 million in 2H2025. For FY2025, other income also increased by 19.5%, or $0.8 million, from $4.2 million in FY2024 to $5.0 million. Overall, the increase was mainly due to the one-off gains on lease termination and other income items, and partially offset by lower government grants and interest income.
Employee benefits expenses
Employee benefits expenses increased by 3.5%, or $1.1 million, from $31.4 million in 2H2024 to $32.5 million in 2H2025. Overall, employee benefits expenses increased by 2.2%, or $1.4 million, from $62.2 million in FY2024 to $63.6 million in FY2025. These increases were primarily due to the increase in manpower headcount required to support our new business operations, as well as corresponding annual salary adjustments and bonuses.
Operating lease expenses
Operating lease expenses increased by 37.5%, or $0.8 million, from $2.3 million in 2H2024 to $3.1 million in 2H2025. Operating lease expenses also increased by 18.4%, or $0.9 million, from $4.7 million in FY2024 to $5.6 million in FY2025. Operating lease expenses increased mainly because one outlet was renewed on a shorter one year lease term which is accounted for as fixed rental expense instead of right-of-use depreciation and interest.
Utilities
Utilities expenses increased by 8.8%, or $0.2 million, from $2.4 million in 2H2024 to $2.6 million in 2H2025. After accounting for a lower spend in 1H2025, utilities expenses increased by 1.4%, or $0.1 million, from $5.0 million in FY2024 to $5.1 million in FY2025. The increase was mainly attributable to the addition of two new outlets in Singapore and higher utilities usage from the Group’s new office, central kitchen and retail premises.
Depreciation and amortisation
Depreciation expenses for property, plant and equipment (“PP&E”) decreased by 5.8%, or $0.2 million, from $3.3 million in 2H2024 to $3.1 million in 2H2025. The decrease was mainly due to a number of PP&E items having reached the end of their depreciation cycle. Despite this decrease in depreciation for PP&E, overall, depreciation for PP&E increased by 4.7%, or $0.3 million, from $6.0 million in FY2024 to $6.3 million in FY2025. This was mainly due to the additional PP&E items invested in connection with the new outlets and the Group’s expanded operations premises.
Depreciation expenses for right-of-use (“ROU”) assets increased by 10.2%, or $0.6 million, from $5.9 million in 2H2024 to $6.5 million in 2H2025. For FY2025, ROU depreciation increased by 13.6%, or $1.6 million, from $11.8 million in FY2024 to $13.4 million in FY2025. The increases were mainly due to additional lease related ROU assets recognised in connection with the new outlets and the Group’s expanded operations premises.
Interest expense
Interest expense increased by 81.6%, or $0.6 million, from $0.8 million in 2H2024 to $1.4 million in 2H2025. For FY2025, interest expense increased by 57.6%, or $0.9 million, from $1.5 million in FY2024 to $2.4 million in FY2025. The increases were due to the increase in lease interest expense in connection with the new outlets and the Group’s expanded operations premises slightly offset by the decrease in loan interest expense.
Other operating expenses
Other operating expenses, which include cleaning services, repairs and maintenance, credit card and delivery service commissions, general supplies and marketing expenses, increased by 35.6%, or $3.2 million, from $9.1 million in 2H2024 to $12.3 million in 2H2025. For FY2025, other operating expenses increased by 18.8%, or $3.6 million, from $18.8 million in FY2024 to $22.4 million in FY2025. The increase was mainly due to a $1.2 million loss on disposal of PP&E, higher marketing expenses of $0.9 million and an increase in general supplies of $0.4 million.
Share of results of associates
Share of results of associates increased by $0.5 million, from a loss of $0.1 million in FY2024 to a gain of $0.4 million in FY2025. This was mainly due to improved operating performance, with several restaurants under our associated companies turning profitable during the year.
Income tax expense
Income tax expense decreased by 37.3%, or $1.6 million, from $4.4 million in FY2024 to $2.8 million in FY2025, mainly due to decrease in profits from our Group’s operations.
Profit attributable to owners of the Company
Profit attributable to the owners of the Company was $0.7 million for 2H2025, compared to $4.8 million in 2H2024. Profit attributable to the owners of the Company decreased by 36.6%, or $5.0 million, from $13.7 million in FY2024 to $8.7 million in FY2025.
Review of the financial position of the Group
Current assets
The Group’s current assets decreased by $7.1 million to $60.3 million as at 30 September 2025, largely due to:
- a decrease of cash and cash equivalents of $8.8 million;
- a decrease in other investments of $0.8 million; and partially offset by
- an increase in trade and other receivables of $1.5 million mainly due to advance payments made to contractors for ongoing projects which will be capitalised as part of PP&E upon completion; and
- an increase in inventories of $1.2 million mainly due to higher stock levels required for the two newly opened outlets and to anticipate upcoming operational needs.
Non-current assets
The Group’s non-current assets increased by $32.5 million to $86.9 million as at 30 September 2025, largely due to:
- an increase in ROU of $28.6 million mainly due to the new long term leases for the Group’s new office, central kitchen and retail spaces;
- an increase in PP&E of $3.1 million due to the new outlets and the Group’s expanded operations premises;
- an increase in deferred tax assets of $1.0 million; and partially offset by
- a decrease in investment in associates of $0.2 million primarily due to the disposal of investments in associates, namely Singapore Seafood Republic Pte. Ltd., SSR Sentosa Pte. Ltd., and share of losses in JBHG F&B Services (Wuhan) Co. Ltd., resulting in a decrease of $0.6 million. This was partially offset by a $0.3 million dividend from Seafood Republic Pte. Ltd. and a share of profit from Vista F&B Pte. Ltd. of $0.5 million; and
- a decrease in intangible assets of $0.1 million, mainly due to the impairment of intangible assets in Taiwan.
Current liabilities
The Group’s current liabilities decreased by $5.9 million to $45.8 million as at 30 September 2025 mainly due to:
- a decrease in trade and other payables of $1.0 million attributable to payments to suppliers as well as payment of employee-related expenses;
- a decrease in lease liabilities of $2.7 million primarily due to the repayment of lease obligations;
- a decrease in bank borrowings of $1.9 million due to repayment of bank loans;
- a decrease in income tax payable of $1.2 million mainly due to lower profits from our Singapore operations; and partially offset by
- an increase in provision for reinstatement costs from the new outlets and the Group’s expanded operations premises.
Non-current liabilities
The Group’s non-current liabilities increased by $29.9 million to $48.3 million as at 30 September 2025 mainly due to:
- an increase in lease liabilities of $32.8 million from the leases of the new outlets and the Group’s expanded operations premises;
- an increase in deferred tax liability of $0.4 million; and partially offset by
- a decrease in bank borrowings $3.3 million due to repayment of bank loans.
Review of the cash flow statement of the Group
The Group generated net cash from operating activities before movements in working capital of $31.5 million as at 30 September 2025. Net cash generated from operations amounted to $26.9 million due to an increase in inventories of $1.2 million, an increase in trade and other receivables of $1.4 million and a decrease in trade and other payables of $1.9 million. Including the $0.5 million interest income received, offset by payment of interest paid of $2.4 million and income tax of $4.6 million, net cash generated from operating activities was $20.5 million as at 30 September 2025.
Net cash used in investing activities for FY2025 amounted to $7.2 million mainly due to:
- acquisition of PP&E of $8.6 million, mainly due to the additional PP&E items invested in connection with the new outlets and the Group’s expanded operations premises;
- acquisitions of other investments of $1.9 million; and partially offset by
- proceeds from disposal of other investments and investments in an associate of $3.1 million.
Net cash used in financing activities for FY2025 amounted to $22.1 million was mainly from the repayment of lease obligations of $10.7 million, repayment of bank borrowings of $5.2 million, dividends paid to owners of the Company and non-controlling interest of $6.0 million and purchases of treasury shares of $0.4 million.
As a result, cash and cash equivalents decreased by $8.8 million during the financial year to $37.5 million as at 30 September 2025.
Commentary on current year prospects
The operating environment for the F&B industry is expected to remain challenging amid cautious consumer sentiment and macroeconomic uncertainties. Against this backdrop, the Group will continue to pursue a strategy of disciplined growth, focusing on strengthening its fundamentals and enhancing operational efficiency while maintaining prudent cost management.
In Singapore, JUMBO will deepen its engagement in the domestic dining market by optimising outlet performance, improving productivity, and aligning its offerings with evolving customer preferences. A key milestone in FY2026 will be completing the Group’s relocation to its new building, which will consolidate the central kitchen and headquarters under one roof. This integration is expected to generate synergies across production, logistics, training and support functions, improving efficiency and scalability in preparation for future expansion.
In PRC, while the market remains competitive, the Group will continue to focus on driving profitability at our existing outlets, with targeted marketing efforts and adjustments to our offerings in response to local consumer trends. The Group also aims to explore opportunities to strengthen its position in the market and drive growth in the medium term, while managing operational costs and risks prudently.
Through disciplined execution, operational excellence, and continuous investment in its people, systems, and infrastructure, the Group aims to navigate the near-term headwinds with resilience while positioning itself for sustainable growth in the years ahead.
Barring any unforeseen circumstances, the Group is cautiously optimistic about its performance over the next 12 months, and we remain committed to driving sustainable growth and value for our stakeholders.