This printed article is located at https://jumbogroup.listedcompany.com/financials.html
Financials
Condensed Interim Consolidated Financial Statements For The Six Months And Full Year Ended 30 September 2023
![]() Note: Files are in Adobe (PDF) format.
Note: Files are in Adobe (PDF) format.
Please download the free Adobe Acrobat Reader to view these documents.
Condensed Interim Consolidated Statements Of Profit Or Loss And Other Comprehensive Income

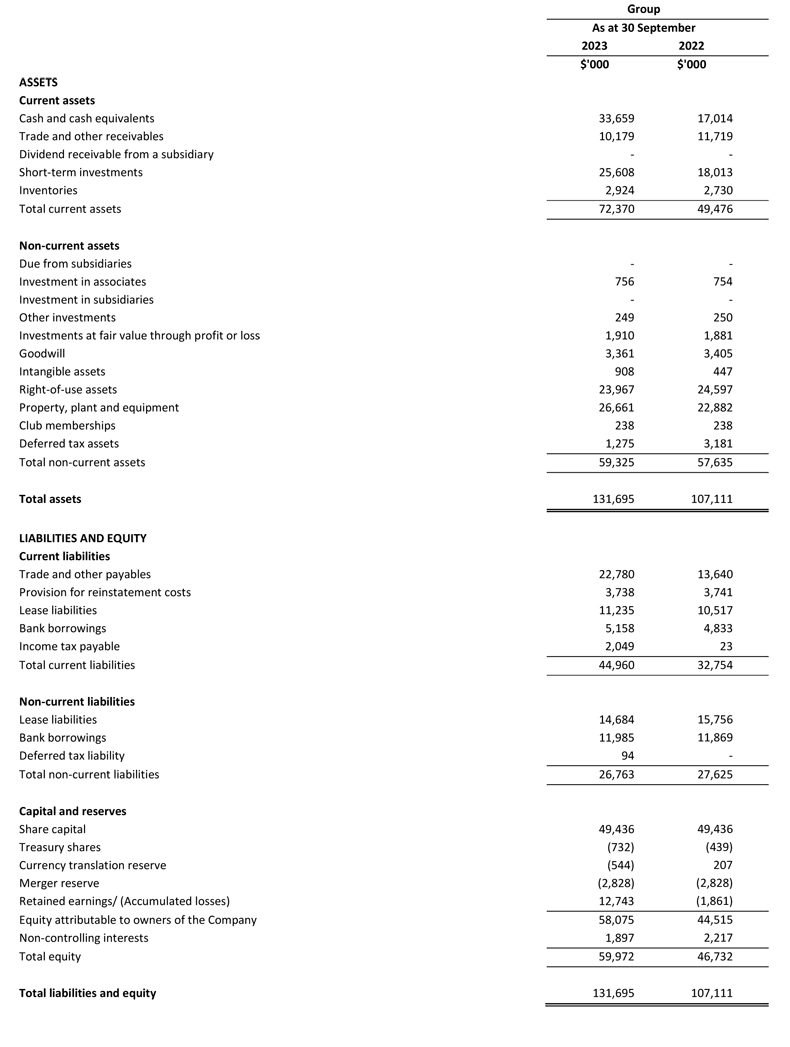
Condensed Interim Statements Of Financial Position
REVIEW OF PERFORMANCE OF THE GROUP
Revenue
Our Group’s revenue increased by 40.7% or $26.8 million, from $66.0 million for the six months period ended 30 September 2022 (“2H2022”) to $92.8 million for the six months period ended 30 September 2023 (“2H2023”). Our Group’s revenue increased by 54.7% or $63.2 million, from $115.6 million for the financial year ended 30 September 2022 (“FY2022”) to $178.8 million for the financial year ended 30 September 2023 (“FY2023”). These increases were mainly due to the increase in revenue from our Singapore operations resulting from the lifting of COVID-19 measures. While revenue from the sale of food and beverages increased, the revenue from franchise income decreased as there was no new franchise outlet in FY2023.
The sustained recovery coupled with the strategic conversion of the SuiYi Gastrobar at The Riverwalk into a Jumbo Seafood outlet in January 2023 resulted in the increase in revenue in the Singapore operations by 46.7% or $24.9 million from $53.3 million in 2H2022 to $78.2 million in 2H2023. Revenue from our Singapore operations increased by 78.0% or $65.0 million from $83.4 million in FY2022 to $148.4 million in FY2023.
Following the end of PRC’s zero-COVID policy in December 2022, our PRC operations experienced a positive shift with an increase in revenue of 15.3% or $1.7 million from $11.0 million in 2H2022 to $12.7 million in 2H2023. However, the zero-COVID policy challenges faced in 1H2023 resulted in an overall decrease in revenue in FY2023 of 6.5% or $1.8 million, from $27.9 million in FY2022 to $26.1 million in FY2023.
Revenue for our Taiwan operations increased by 17.5% or $0.3 million from $1.6 million in 2H2022 to $1.9 million in 2H2023. This increase is offset by a decrease of 11.2% or $0.3 million, from $2.7 million in 1H2022 to $2.4 million in 1H2023 largely due to a three-week shutdown of operations in our Taipei outlet for renovation. As a result, revenue from Taiwan operations remained constant at $4.3 million in FY2022 and FY2023.
Cost of sales
Cost of sales, which comprised raw materials and consumables, increased by 46.5% or $10.3 million, from $22.3 million in 2H2022 to $32.6 million in 2H2023. Cost of sales increased by 52.1% or $21.1 million, from $40.6 million in FY2022 to $61.7 million in FY2023. These increases are in-line with the increase in revenue.
Gross profit
Gross profit increased by 37.8% or $16.5 million, from $43.7 million in 2H2022 to $60.2 million in 2H2023. Gross profit margin decreased by 1.4 percentage points to 64.9% in 2H2023 from 66.3% in 2H2022. Gross profit increased by 56.1% or $42.0 million, from $75.0 million in FY2022 to $117.0 million in FY2023. Despite the decrease in gross profit margin in 2H2023 compared to 2H2022, gross profit margin increased by 0.6 percentage point from 64.9% in FY2022 to 65.5% in FY2023.
Other income
Other income increased by 42.8% or $0.4 million, from $0.9 million in 2H2022 to $1.3 million in 2H2023. Other income increased by 124.9% or $2.8 million, from $2.2 million in FY2022 to $5.0 million in FY2023. This is mainly due to an increase in government grants and credit scheme, fair value gains on investments at FVTPL and on shortterm investments recognised.
Employee benefits expenses
Employee benefits expenses increased by 60.9% or $11.3 million from $18.5 million in 2H2022 to $29.8 million in 2H2023. Employee benefits expenses increased by 52.8% or $19.5 million from $36.9 million in FY2022 to $56.4 million in FY2023. These increases in employee benefit expenses are mainly due to increases in headcount to support the increases in revenue, basic pay and bonuses.
Operating lease expenses
Operating lease expenses decreased by 37.7% or $0.8 million, from $2.2 million in 2H2022 to $1.4 million in 2H2023. Operating lease expenses increased by 49.0% or $1.5 million from $3.0 million in FY2022 to $4.5 million in FY2023. This increase is due to higher variable rent resulting from higher revenue.
Utilities expenses
Utilities expenses increased by 20.7% or $0.5 million, from $2.2 million in 2H2022 to $2.7 million in 2H2023. Utilities expenses increased by 31.9% or $1.2 million from $3.9 million in FY2022 to $5.1 million in FY2023. These increases are due to the increase in revenue and higher utility rates.
Depreciation and amortisation
Depreciation expense for property, plant and equipment (“PP&E”) remained unchanged at $2.9 million in 2H2022 and 2H2023. Depreciation for PP&E decreased by 3.7% or $0.2 million from $5.8 million in FY2022 to $5.6 million in FY2023 mainly due to the increase in fully depreciated PP&Es in FY2023.
Depreciation expense for right-of-use (“ROU”) assets increased by 10.9% or $0.6 million from $5.7 million in 2H2022 to $6.3 million in 2H2023. ROU assets increased by 2.2% or $0.3 million from $11.8 million in FY2022 to $12.1 million in FY2023. The increases in depreciation expense for ROU are due to renewal of leases and one new outlet.
Interest expense
Interest expense for leases remained unchanged at $0.5 million in 2H2022 and 2H2023 and $1.0 million in FY2022 and FY2023.
Interest expense for loans increased by 44.9% or $0.1 million, from $0.2 million in 1H2022 to $0.3 million in 2H2023. Interest expense for loans increased by 20.0% or $0.1 million, from $0.4 million in FY2022 to $0.5 million in FY2023. The increases are due to a mortgage loan being drawn down in December 2022, partially offset by repayment of bank loans.
Other operating expenses
Other operating expenses, which includes cleaning services, repairs & maintenance, credit card & delivery services commission, general supplies and marketing expenses, increased by 13.2% or $1.1 million from $7.8 million in 2H2022 to $8.9 million in 2H2023. Other operating expenses increased by 27.0% or $3.8 million from $14.2 million in FY2022 to $18.0 million in FY2023. These increases are in-line with the general increase in business activities.
Income tax expense
The income tax expense of $2.2 million in 2H2023 and $4.2 million in FY2023 was recognised mainly due to the Singapore operations returning to a taxable position.
Profit attributable to owners of the Company
As a result of the above, profit attributable to owners of the Company saw an increase of 52.0% or $2.3 million from $4.4 million in 2H2022 to $6.7 million for 2H2023. For FY2023, profit attributable to owners of the Company stood at $14.6 million compared to a loss of $0.1 million in FY2022.
Review of the group's Financial Position
Current assets
The Group’s current assets increased by $22.9 million to $72.4 million as at 30 September 2023, largely due to (i) an increase in short-term investments of $7.6 million, as the Group placed cash generated from operations and funds from bank borrowings to bank managed funds to generate returns to offset interest expense; (ii) an increase in inventories of $0.2 million; and (iii) an increase in cash and cash equivalents of $16.7 million from operations during the year; and partially offset by a decrease in trade and other receivables of $1.5 million.
Non-current assets
The Group’s non-current assets increased by $1.7 million to $59.3 million as at 30 September 2023, largely due to an increase in PP&E of $3.8 million mainly due to the acquisition of a property for restaurant operations and renovations for a few outlets during the year; and partially offset by a decrease in deferred tax assets of $1.9 million due to utilization of tax losses brought forward from prior years.
Current liabilities
The Group’s current liabilities increased by $12.2 million to $45.0 million as at 30 September 2023 mainly due to (i) an increase in trade and other payables of $9.1 million mainly due to higher business activities during the year; (ii) an increase in income tax payable of $2.0 million due to higher profits in FY2023; (iii) an increase in lease liabilities of $0.7 million due to the signing of new lease for Mutiara Seafood outlet and lease renewals; and (iv) an increase in bank borrowings of $0.3 million due to the drawdown of a mortgage loan to fund the acquisition of a property.
Non-current liabilities
The Group’s non-current liabilities decreased marginally by $0.9 million to $26.8 million as at 30 September 2023.
REVIEW OF THE GROUP'S CASH FLOW STATEMENT
The Group generated net cash from operating activities before movements in working capital of $37.3 million in FY2023. Net cash generated from operations amounted to $47.2 million due to a decrease in trade and other receivables of $1.0 million, an increase in trade and other payables of $9.0 million and slightly offset by an increase in inventories of $0.2 million. Including the $1.5 million paid for interest and income tax and $0.6 million interest income received, net cash generated from operating activities were $46.2 million in FY2023.
Net cash used in investing activities amounted to $17.5 million mainly due to (i) an acquisition of property, plant and equipment of $10.0 million, of which $5.5 million was for the acquisition of a property for restaurant operations, while the remaining was for renovation for our new Mutiara Seafood outlet at Wisma Geylang Serai and existing outlets, namely the JUMBO Seafood outlets at IFC in Shanghai, and at The Riverwalk and Dempsey in Singapore; (ii) $7.4 million deployed to short-term investments to generate returns to offset interest expense on bank borrowings; and (iii) the repurchase of treasury shares that amounted to $0.3 million.
Net cash used in financing activities for FY2023 of $12.6 million was mainly due to the repayment of lease obligations of $12.9 million and repayment of bank borrowings of $4.0 million and partially offset by the drawdown of a $4.4 million mortgage loan for the acquisition of a property for restaurant operations.
As a result, cash and cash equivalents increased by $16.1 million during the financial year to $33.7 million as at 30 September 2023.
Commentary on current year prospects
As we begin the new financial year, our Group holds a positive outlook on our Singapore operations. The lifting of vaccination-differentiated safe management measures in October 2022 and subsequent border relaxations globally have revived our key brands— JUMBO Seafood, and Zui Teochew Cuisine— bringing revenue back to pre-COVID levels. Despite the revenue growth, we are mindful of challenges arising from increased operational costs such as raw materials, labour and utilities.
While benefitting from the eased restrictions in Singapore and global reopenings, we are aware of potential challenges, especially uncertainties from the PRC market. Sales in PRC have not fully recovered from pre-COVID levels and getting back on track might take time due to tough economic conditions.
Our strategy is to adapt, innovate and manage our resources efficiently to navigate challenges and seize opportunities for sustainable growth. We are committed to closely monitoring these developments and taking necessary steps for steady growth and profitability. Barring any unforeseen circumstances, we remain cautiously optimistic for the next 12 months.